
Low Cycle Fatigue (LCF)
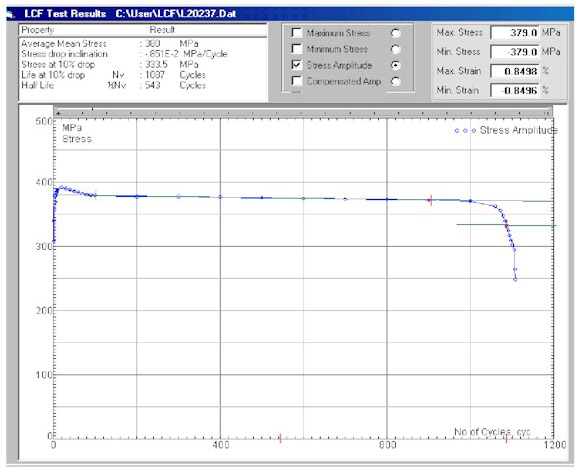
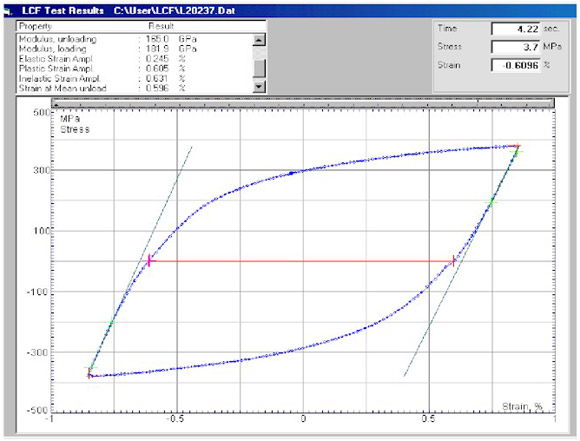
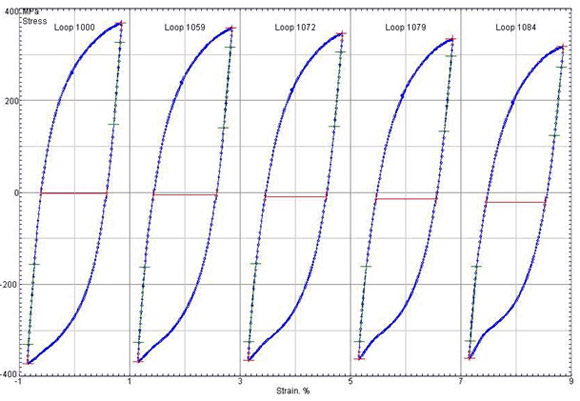
The program reads either hysteresis loop data or the summary data, cycles vs. max. and min. load and strain data or both; draws a plot of stress vs. no of cycles. After a few cycles, the stress-strain path generally becomes stable. A percentage stress decrease defines the ‘failure cycle count’, Nv. The specific variables determining specimen life can be calculated directly from the 0.5Nv hysteresis loop. The loading and unloading modulus, the plastic and elastic strain portions, max. and min. strain, mean and amplitude strain, max. and min. stress, mean and amplitude stress are calculated.
The results can be printed either in graphical form or text form, either on a laser printer or inkjet printer. The header page can be customised to the user specifications.